Spring Cloud使用Hystrix Dashboard(熔断仪表盘)查看监控数据
我们已经知道 Hystrix 提供了监控的功能,可以通过 hystrix.stream 端点来获取监控数据,但是这些数据是以字符串的形式展现的,实际使用中不方便查看。我们可以借助 Hystrix Dashboard 对监控进行图形化展示。
Hystrix Dashboard 是一款针对 Hystrix 进行实时监控的工具,通过 Hystrix Dashboard 可以直观地看到各 Hystrix Command 的请求响应时间,请求成功率等数据。
下面我们单独创建一个项目来集成 dashboard。
创建一个 Maven 项目 hystrix-dashboard-demo,在 pom.xml 中添加 dashboard 的依赖,代码如下所示。
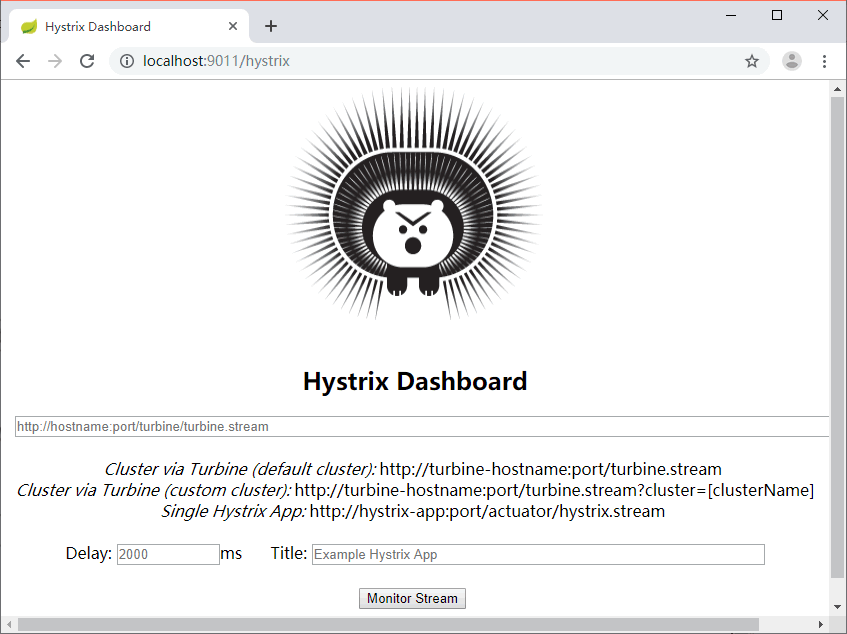
图 1 dashboard 主页
在主页中有 3 个地方需要我们填写,第一行是监控的 stream 地址,也就是将之前文字监控信息的地址输入到第一个文本框中。第二行的 Delay 是时间,表示用多少毫秒同步一次监控信息,Title 是标题,这个可以随便填写,如图 2 所示。
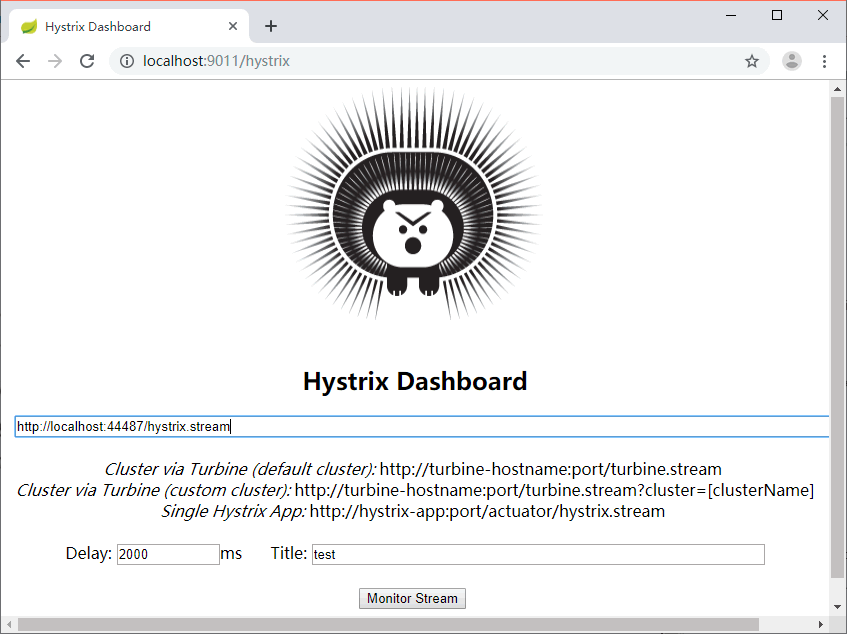
图 2 dashboard 参数填写
输入完成后就可以点击 Monitor Stream 按钮以图形化的方式查看监控的数据了,如图 3 所示。
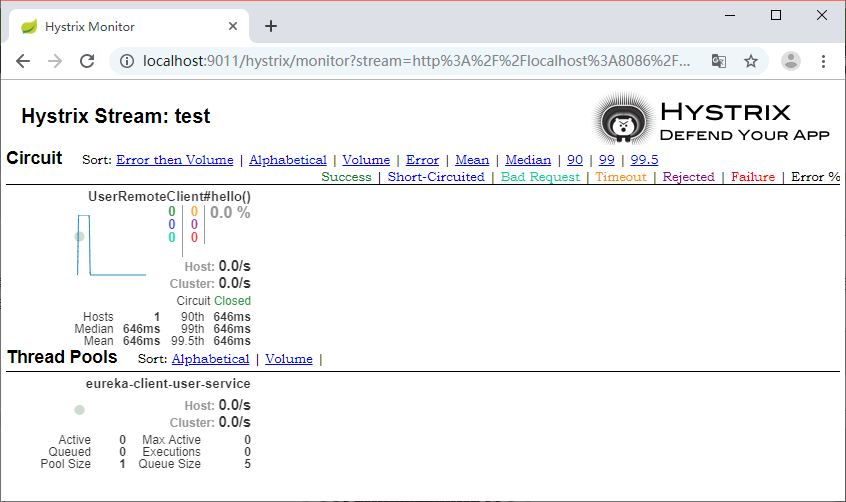
图 3 dashboard 数据监控输出页面
Hystrix Dashboard 是一款针对 Hystrix 进行实时监控的工具,通过 Hystrix Dashboard 可以直观地看到各 Hystrix Command 的请求响应时间,请求成功率等数据。
下面我们单独创建一个项目来集成 dashboard。
创建一个 Maven 项目 hystrix-dashboard-demo,在 pom.xml 中添加 dashboard 的依赖,代码如下所示。
<dependency>
<groupId>org.springframework.cloud</groupId>
<artifactId>spring-cloud-starter-netflix-hystrix-dashboard</artifactId>
</dependency>
@SpringBootApplication
@EnableHystrixDashboard
public class DashboardApplication {

    public static void main(String[] args) {
        SpringApplication.run(DashboardApplication.class, args);
    }
}
在属性配置文件中只需要配置服务名称和服务端口:
spring.application.name=hystrix-dashboard-demo
server.port=9011
图 1 dashboard 主页
在主页中有 3 个地方需要我们填写,第一行是监控的 stream 地址,也就是将之前文字监控信息的地址输入到第一个文本框中。第二行的 Delay 是时间,表示用多少毫秒同步一次监控信息,Title 是标题,这个可以随便填写,如图 2 所示。
图 2 dashboard 参数填写
输入完成后就可以点击 Monitor Stream 按钮以图形化的方式查看监控的数据了,如图 3 所示。
图 3 dashboard 数据监控输出页面
所有教程
- C语言入门
- C语言编译器
- C语言项目案例
- 数据结构
- C++
- STL
- C++11
- socket
- GCC
- GDB
- Makefile
- OpenCV
- Qt教程
- Unity 3D
- UE4
- 游戏引擎
- Python
- Python并发编程
- TensorFlow
- Django
- NumPy
- Linux
- Shell
- Java教程
- 设计模式
- Java Swing
- Servlet
- JSP教程
- Struts2
- Maven
- Spring
- Spring MVC
- Spring Boot
- Spring Cloud
- Hibernate
- Mybatis
- MySQL教程
- MySQL函数
- NoSQL
- Redis
- MongoDB
- HBase
- Go语言
- C#
- MATLAB
- JavaScript
- Bootstrap
- HTML
- CSS教程
- PHP
- 汇编语言
- TCP/IP
- vi命令
- Android教程
- 区块链
- Docker
- 大数据
- 云计算